LibreOffice Development Talk at Triangle C++ Developer’s Group

It was a pleasure to have been given an opportunity to talk about LibreOffice development the other day at the Triangle C++ Developer’s Group. Looking back, what we went through was a mixture of hardship, accomplishments, and learning experience intertwined in such a unique fashion. It was great to be able to talk about it and hopefully it was entertaining enough to those of you who decided to show up to my talk.

Here is a link to the slides I used during my talk.

Thanks again, everyone!

Edit: Here is a PDF version of my slides for those of you who don’t have a program that can open odp files.

Increasing Calc’s row limit to 1 million

Introduction

With the child work space (CWS) koheirowlimitperf being marked ready for QA, I believe this is a good time to talk about the change that the CWS will bring once it gets integrated.

The role of this CWS is to upstream various pieces of performance optimization from Go-OO, that arose from the increase of the row limit from 65536 (64 thousand rows) to 1048576 (1 million rows). However, the upstream build will not see the increase of the row limit itself yet, as the upstream developers still consider that move premature due to two outstanding issues that are show stoppers for them. I’ll talk more about those issues later.

What this CWS does change is the storage of row attributes to 1) improve performance of querying the attributes, and to 2) make extra information available that can be used to make the algorithm of various bits of operations more efficient. The CWS also makes several other changes in order to improve performance in general, though not related to the change in the row attribute storage.

Limitation of the old attribute storage

Before I talk about how the row attributes are stored in the new storage, I’d like to talk about the limitation of the old attribute storage, and why it was not adequate when the row limit was raised to 1 million rows. Also, in this article, I’ll only talk about row attribute storage, but the same argument also applies to the column attribute storage as well.
The old attribute container was designed to store several different attributes altogether, namely,

  • hidden state,
  • filtered state,
  • automatic page break position,
  • manual page break position, and
  • whether or not a row has a manual height.

They were stored per range, not per individual row or column, so that if a range of rows had identical set of attribute values over the entire range, that attribute set would be stored as a single record. Searching for the value of an attribute for an arbitrary row was performed linearly from the first record since the core of the container itself was simply just an array.

There were primarily two problems with this storage scheme that made the container non-scalable. First, the attributes stored together in this container had different distribution patterns, which caused over-partitioning of the container and unnecessarily slowed down the queries of all stored attributes.

For instance, the hidden and filtered attributes are distributed in a very similar manner, but the manual height attribute is not necessarily distributed in a manner similar to these attributes. Because of this, storing that together with the hidden and filtered attributes unnecessarily increased the partition count, which in turn would slow down the query speed of all three attributes.

Even more problematic was the automatic page break attributes; because the automatic page breaks always need to be set for the entire sheet, increasing the row limit significantly raised the partition count. On top of that, the page breaks themselves are actually single-row attributes; it made little sense to store them in a container that was range-based.

This over-partitioning problem led to the second problem; when the container was over-partitioned, querying for an attribute value would become very slow due to the linear search algorithm used in the query, and this algorithm scales with the number of partitions. Because row attributes are used extensively in many areas of Calc’s operations, and often times in loops, the degradation of its lookup performance caused all sorts of interesting performance problems when the row limit was raised to 1 million.

New way of storing row attributes

Separation of row attributes

The first step in speeding up storage and lookup of row attributes is to separate them into own containers, to avoid the storage of one attribute affecting the storage of another. It was natural to use a range-based container to store the hidden, filtered and the manual height attributes, since these attributes typically span over many consecutive rows. The page break positions, on the other hand, should be stored as point values as opposed to range values since they rarely occur in ranges and they are always set to individual rows.

I picked STL’s std::set container to store the automatic and manual page break positions (they are stored separately in two set containers). That alone resulted in significantly speeding up the sheet pagination performance, whose performance previously suffered due to the poor storage speed of the old container. Later on I improved the pagination performance even further by modifying the pagination algorithm itself, but more on that later.

For the hidden and filtered attributes, I picked a data structure that I call the flat segment tree, which I designed and implemented specifically for this purpose. Row heights are also stored in the flat segment tree.

Flat segment tree

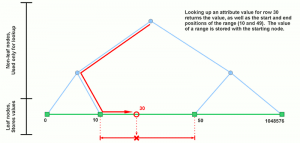
I named this data structure “flat segment tree” because it is a modified version of a data structure known as the segment tree, and unlike the original segment tree which supports storage of overlapping ranges, my version only stores non-overlapping ranges, hence the name “flat”. The structure of the flat segment tree largely resembles that of the original segment tree; it consists of a balanced binary tree with its leaf nodes storing the values while its non-leaf nodes storing auxiliary data used only for querying purposes. The leaf nodes are doubly-linked, allowing them a quick access to their neighboring nodes. Since ranges never overlap with each other in this data structure, one leaf node represents the end of a preceding range and the start of the range that follows. Last but not least, this data structure is a template, and allows you to specify the types of both key and value.
flat-segment-tree-lookup

There are three advantages of using this data structure: 1) compactness of storage since only the range boundaries are stored as nodes, 2) reasonably fast lookup thanks to its tree structure, and 3) a single query of a stored value also returns the lower and upper boundary positions of that range with no additional overhead. The last point is very important which I will explain later in the next section.

As an additional rule, the flat segment tree guarantees that the values of adjacent ranges are always different. There is no exception to this rule, so you can take advantage of this when you use this structure in your code.

Also, please do keep in mind that, while the lookup of a value is reasonably fast, it is not without an overhead. So, you are discouraged to perform, say, lookup for every single row when you are iterating through a series of rows in a loop. Instead, do make use of the range boundary info judiciously to skip ahead in such situation.

This data structure is distributed independently of the OOo code base, licensed under MIT/X11. You can find the source code at http://code.google.com/p/multidimalgorithm/. That project includes other data structures than the flat segment tree; however, only the flat segment tree is currently usable by 3rd party programs; the implementations of other structures are still in an experimental stage, and need to be properly templetized before becoming usable in general. Even the flat segment tree is largely undocumented. This is intentional since the API is still not entirely frozen and is subject to change in future versions. You have been warned.

Loop count reduction

Aside from the aforementioned improvement associated with the row attribute storage, I also worked on improving various algorithms used throughout Calc’s core, by taking advantage of one feature of the new data structure.
loop-for-each-row
As I mentioned earlier, the flat segment tree returns the lower and upper boundary positions of the range as part of a normal value query. You can make use of this extra piece of information to significantly reduce the number of loops in an algorithm that loops through a wide row range. Put it another way, since you already know the attribute value associated with that range, and you also know the start and end positions of that range, you don’t need to query the value for every single row position within that range, thus reducing the number of iterations in the loop. And the reduction of the loop count means the reduction of the time required to complete that operation, resulting in a better performance.

That’s the gist of the performance improvement work I did in various parts of Calc, though there were slight variations depending on which part of Calc’s code I worked on. In summary, the following areas received significant performance improvement:

  • Sheet pagination, which consisted of loops in which numerous calls are made to query row’s hidden states and row height values.
  • Print preview, mostly due to the improvement of the pagination performance.
  • Calculation of drawing object’s vertical position

I’m sure there are other areas where the performance still needs improvement. As this is an on-going effort, we will work on resolving any other outstanding issues as we discover them.

Other related work

In addition to the re-work of the row attribute storage and the performance improvement involving the row attribute queries, I’ve also made other changes to improve performance and ensure that Calc’s basic usability is not sacrificed.

Removal of redundant pagination

Prior to my row limit increase work, Calc would re-calculate page break positions again and again even when no changes were made to the document that would alter page break positions, such as changing row heights, filtering rows, inserting manual page breaks, and so on. Because the pagination operation became much more expensive after the row limit increase, I have decided to remove this redundancy so that the re-pagination is done only when necessary. This change especially made huge impact in print preview performance, since (for whatever reason) Calc was performing full pagination every time you move the mouse cursor within the preview pane, even when the movement was only by one pixel! Removal of such redundant re-pagination has brought sanity back to the print preview experience.

Efficient zoom level calculation

The row limit increase also caused the performance degradation of calculating the correct zoom size to fit the document within specified page size. Calc does this when you specify your document to “fit within n pages wide and y pages tall” or “fit to n pages in total”. The root cause was again in the degraded performance in pagination. This time, however, I could not use the trick of “performing pagination only once”, because we do need to perform full pagination continuously at different zoom levels in order to find a correct zoom level.

The solution I employed was to reduce the number of re-pagination by using the bisection method to arrive at the correct zoom level. The old code worked like this:

  1. Initialize the zoom level to 100%, and perform full pagination.
  2. If that doesn’t fit the required page size, decrement the zoom level by 1%, and perform full pagination once again.
  3. If that doesn’t fit, decrement the zoom level by 1%, and try again.
  4. Continue this until the correct zoom level is reached.

Of course, if the correct zoom level is far below the initial value of 100%, this algorithm is not very efficient. If the desired zoom level is 35%, for example, Calc would need to perform full pagination 66 times. Switching to the bisection method here reduced the full pagination count roughly down to the neighborhood of 5 or 6. At the time I worked on this, each full pagination took about 1 second. So the reduction of pagination count from 66 to 5 roughly translated to the reduction of the zoom level calculation from 1 minute to 5 seconds. Suffice it to say that this made a big difference.

Even better news is that the performance of this operation is much faster today, thanks to the improvement I made in the pagination performance in general.

Calculation of autofill marker position
autofill
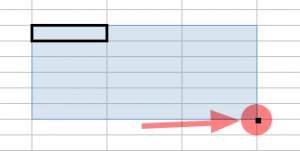
When making a selection, Calc puts the little square at the lower-right corner of the selection. That’s called an autofill marker, and it’s there to let you drag selection to fill values.

Interestingly, calculating its position (especially its vertical position) turned out to be a very slow operation when the marker was positioned close to the bottom of the sheet. Worse is the fact that Calc calculated its position even when it was outside the visible area. The slowdown caused by this was apparent especially when making column selection. Because selecting columns always places the autofill marker at the last row of the sheet, increasing the row limit made that process sluggish. The solution was to simply detect whether the autofill marker is outside the visible area, and if it is, skip calculating its position (since there is no point calculating its position if we don’t need to display it). That made the process of column selection back to normal again.

However, the sluggishness of making selection can still manifest itself under the right (wrong?) condition even with this change. We still need to speed up the calculation of its vertical position, by improving the calculation algorithm itself.

Show stoppers for the upstream build

I sat down and briefly discussed with Niklas Nebel and Eike Rathke, Sun’s Calc co-leads, when we met during last year’s OOoCon in Orvieto, about the possibility of increasing the row limit in the upstream version of Calc. During our discussion, I was told that, in addition to the general performance issues most of which I’ve already resolved, we will need to resolve at least two more outstanding issues before they can set the row limit to 1 million in the upstream build.

First, we need to improve the performance of the formula calculation and the value change propagation mechanism (that we call “broadcasting”). The existing implementation is still tuned for the grid size of 65536 rows; we need to re-tune that for 1 million rows and to ensure that the performance will not suffer after the row limit increase.
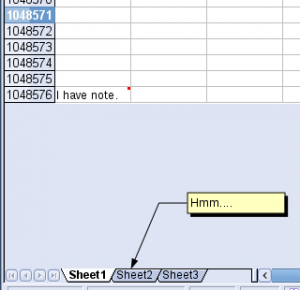
cell-note-misplaced

Second, we need to resolve the incorrect positioning of drawing objects at higher row positions. This one is somewhat tricky, since the drawing objects are drawn entirely independent of the sheet grid, and the coerce resolution of the drawing layer causes the vertical position of a drawing object to deviate from its intended position. Generally speaking, the higher the row position the more deviation results. With the maximum of 65536 rows, however, it was not such a big issue since the amount of deviation was barely noticeable even at the highest row position. But because the problem becomes much more noticeable with 1 million rows, this needs to be addressed somehow.

Going forward…

Going forward, I will continue to hunt for the remaining performance issues, and squash them one by one. The major ones should all be resolved by now, so what’s remaining should be some corner case issues, performance-wise. As for the two outstanding issues I mentioned in the previous section, we will have to take a good look at them at some point. Whether or not they are really show stoppers is somewhat subject to personal view point, but they are real issues needing resolution, for sure, no matter what their perceived severity is.

Also, as of this writing, the manual row size attribute is still stored in the old, array-based container. It will probably make sense to migrate that to the flat segment tree, so that we can eliminate the old container once and for all, and have a fresh start with the new container. Having said that, doing so would require another round of refactoring of non-trivial scale, it should be conducted with care and proper testing.

The ODS export filter still needs re-work. Currently, all row attributes which are now stored separately, are temporarily merged back into the old array-based container before exporting the document to ODS. The reason is that the ODS export filter code still expects the partitioning behavior of the old container during the export of row styles. In order to fully embrace the new storage of row attributes, that code needs to be adjusted to work with the new storage scheme. Again, this will require a non-trivial amount of code change, thus should be conducted with care.

Calculation of vertical position of various objects, such as the autofill marker can still use some algorithmic improvement. We can make them more efficient by taking advantage of the flat segment tree in a way similar to how the pagination algorithm was made more efficient.

Conclusion

This concludes my write-up on the current status of Calc’s row limit increase work. I hope I’ve made it clear that work is underway toward making that happen without degrading Calc’s basic usability. As a matter of fact, the row limit has already been increased to 1 million in some variants of OOo, such as Go-OO. I believe we’ll be able to increase the row limit in the upstream version in the not-so-distant future as long as we keep working at the remaining issues.

That’s all I have to say for now. Thank you very much, ladies and gentlemen.

Inserting current date and time in one step

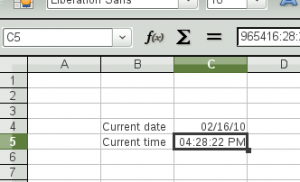
current-date-time
Here is another simple feature that may come in handy.

With the change I just checked into ooo-build master, you can now insert current date and time with just one key stroke. By default, Ctrl+; (semicolon) is bound to current date, while Ctrl+Shift+; is bound to current time. But these key bindings are configurable in case you don’t like these default bindings.

Two more enhancements are in

Today, I’d like to talk about two minor enhancements I just checked in to ooo-build master. They are not really earth-shuttering per se, but still worth mentioning & may be interesting to some users.

Insert new sheet tab

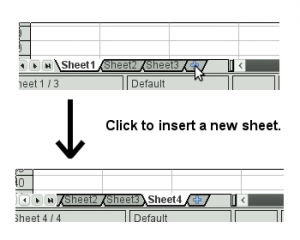
insert-sheet-shot

Here is the first enhancement. In Calc, you’ll see a new tab at the right end of the sheet tabs, to allow quick insertion of new sheets. Each time you click this tab, a new sheet gets inserted to the right end. The sheet names are automatically assigned.

Previously, inserting a new sheet has to be done by opening the Insert sheet dialog, selecting the position of the new sheet and how many new sheets are to be inserted etc. But if you always append a single sheet at the right end and don’t care to name the new sheet (or name it after the sheet is inserted), this enhancement will save you a few clicks. Implementing this was actually not that hard since I was able to re-use the existing code for most of its functionality. I personally wanted to give it a little more visual appeal, but that will be a future project.

Anyway, I hope some of you will find this useful.

English function names in non-English locale

The second enhancement is related to cell functions. If you use a localized version of OOo, you probably know that the function names are localized. But there has been quite a few requests to support English function names even if the UI is localized. This is where this enhancement comes in.

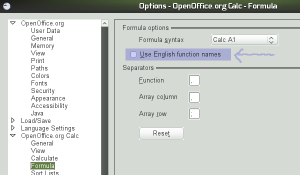
First, there is now an additional check box in the Formula options page:
english-func-option
By default, the check box is off, which means the localized function names are used. Checking this check box will swap localized function names with the English ones across the board. You can of course uncheck it to go back to the localized function names.

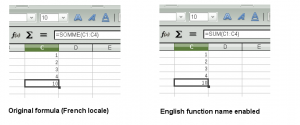
For example, in French locale, the name of the function that calculates a summation of a cell range is called SOMME, but when the English function name option is enabled, this becomes SUM as you can see in the following screenshot:
english-func-displayed

This change takes effect in all of the following areas:

  • formula input and display,
  • function wizard, and
  • formula tips.

As always, please test this thoroughly, and report any bugs. Thanks!

Distributed text justification

What’s new?

Here is something I’ve been working on for the past few weeks. Since I just checked in the first version of this feature into ooo-build master, it’s probably a good time for me to talk about this.

This feature introduces a new justification option for cell text known as the “distributed justification”, where the left and right edges of the text are aligned with the left and right edges of the bounding box by adjusting space between characters (inter-character spacing), rather than space between words (inter-word spacing), across the entire width of the bounding box. This type of distributed text justification makes little sense for Latin-based languages such as English, French and German, but makes a big difference for Asian languages such as Japanese. The reason the normal justification doesn’t work for Asian languages is because, in those languages, you don’t put spaces between individual word boundaries, and the normal justification relies on presence of spaces at word boundaries. This is where the distributed justification comes into play.

This distributed justification method is commonly known as ?????? in Japanese, and is said to be one of the blockers when attempting to migrate users away from Excel to Calc.

Horizontal justification

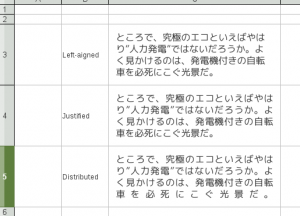
First and foremost, I’d like to cover the horizontal justification. The following screenshot shows the difference between the three horizontal alignment modes:

calc-text-hor-align

As you can see, in the normal left-aligned text, the right edges of the lines are not aligned. When the text is justified, the right edges of the lines are now aligned by adjusting the inter-character spacing, except for the last line, which remains left-aligned. When the text is distributed, even the right edge of the last line becomes aligned with the right edge of the bounding box by equally distributing the characters on that line.

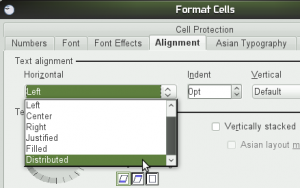
To allow this new justification type, I added a new justification type Distributed to the existing Cell Formatting dialog.

calc-text-align-dlg

For the vertical alignment setting, I’ve added two new options Justified and Distributed, to support justification in the vertical direction.

Justifying Asian text mixed with Latin text

While working on this feature, I have decided to also tweak the normal justification algorithm to make it work slightly better for Asian text mixed with Latin text such as English. As I mentioned earlier, distributed justification is not really ideal for Latin text. But with the society becoming more and more global, we are seeing more and more Asian text intermixed with Latin text, and vise versa. And correctly justifying a text having mixed script types requires using different justification methods for their respective script types. After a bit of trial and error, I think I got it right. You can see the result in the following screenshot:

mixed-script-justification

The English portion of the text is justified by inter-word justification, whereas the Japanese portion is justified by inter-character justification. The spaces between the English and Japanese text portions are also slightly adjusted in this scheme.

Vertical justification

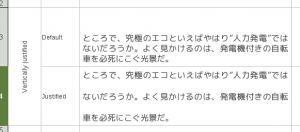
Now, let’s move on to the vertical justification. When you justify a text in the vertical direction, that is, in the direction perpendicular to the direction of text flow, the spacing between the lines gets adjusted so that the top and bottom lines get aligned with their respective edges of the bounding box, like so:
vertically-justified
The top cell shows text with default justification, while the bottom cell shows text with vertical justification.

The Cell Format dialog itself provides both Justified and Distributed options for the vertical justification setting, but they do exactly the same thing for horizontally-flowing text. For vertically-flowing text, on the other hand, they do different things, but more on that in the next section.

Justifying vertically flowing text

Now, you can also justify text even when the text is flowing vertically. There are three ways you can make the text flow vertically. You can either

  1. rotate 90 degrees to the right (bottom-to-top),
  2. rotate 90 degrees to the left (top-to-bottom), or
  3. switch to Asian layout mode, which flows text in the top-to-bottom, right-to-left direction.

In these modes, the Justified and Distributed vertical justification options do have different effects. The following screenshot demonstrates different vertical alignment settings in three different vertical flow modes.

vertially-flowing-paragraph

As an added bonus…

The code responsible for the text layout, the code where I made my modification to support this feature, is actually shared between Calc, Draw and Impress. Calc uses it to render complex cell text, while Draw and Impress use it for their text box objects. This means that, any improvement I make in this area will automatically be made available for all three applications. All that needs to be done is to simply adjust the UI in each app and add hooks in their respective import/export filters. Whether or not I’ll work on that during this cycle is another question. Having said that, I’d like to eventually get that done, and I’d like to do it sooner rather than later. But we’ll see how that goes.

But even without making the extra code change in the Draw/Impress code, my change so far was enough to fix this bug which I didn’t even know existed. :-)

Lastly…

As of this writing, I’m not entirely done with this feature yet. I still have to cover some corner cases, and I still need to fix some bugs which I unfortunately discovered while taking screenshots for this post. So, stay tuned for further fine-tuning!

DBF import performance

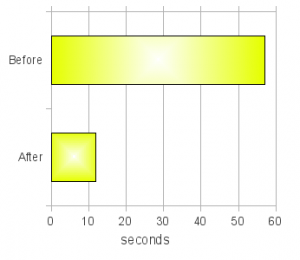
dbf-import-perfHere is another performance win! Importing dbf files into Calc is now quicker by 80%. You will probably notice the difference especially when importing a large dbf file. The test document I used had roughly 24000 rows, and importing that took 57 seconds on my machine. Having 24000 rows in a database file (or even in a spreadsheet file) is very common by today’s standard, so this wasn’t good at all.

I had done quite a bit of performance work over the years, but this one was somewhat difficult to tackle. The bottlenecks were fragmented all over the place which required different solutions to different areas. Roughly speaking, the following are the areas I tackled to reduce the total import time for dbf files (module name in parentheses):

  • speedup in parsing of dbf file content (connectivity)
  • disabled property change notification during dbf import (dbaccess)
  • more efficient string interning and unicode conversion (sal)
  • reduction in column array re-allocation during import (sc)
  • removal of unnecessary column and row size adjustments post-import (sc)

With all of this, the file that originally took 57 seconds to load now loads in 12 seconds on the same hardware, which roughly translates to 80% reduction of the total import time!

This itself is pretty impressive; however, I was hoping to get it at least under 10 seconds since Excel can load the same file less than 5 seconds on the same hardware, even through wine emulation (!). But that’s probably for a future project. For now, I’m content with what I’ve done.

Updates on various stuff

Ok. Here is some updates on some of the stuff I’ve been doing lately. I picked the ones that are particularly worth mentioning.

Saving documents

There are two changes related to the document-saving functionality that I’d like to mention. The first one is the new icon in the document modified status window. As I blogged before, I had made a minor polish to the existing document modified status window, to show the status graphically instead of simply showing ‘*’ when the document is modified. The only problem was that the icon I used to fill that space was pretty lame and ugly. But thanks to jimmac, we now have a much better icon to show the modified status (see below).
doc-modified

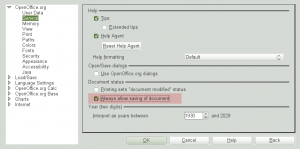
The second thing is with the save icon itself. It has been known to us that some users want the ability to always save the document even when the document is not considered “modified”, while others want the save action disabled when the document is not “modified”. I quote the term modified here because even when the content of the document has not changed, some peripheral data may have changed, such as the zoom level, cursor position, active sheet and so on and so forth. These peripheral data (that we call the “view data”) are still stored with the document, but changes in these data do not set a document modified status. So, if you wanted to save your document with the cursor at a particular location, a certain sheet activated and the zoom level set to a certain level, you had to make a fake change to the content to be able to save the document with the view data change. The solution we had employed previously was to always enable this only for Calc, where the request for this behavior was greatest. However, some users still found it confusing that only Calc enables the save all the time while the rest of the applications didn’t. Also, a lot of users used the save icon itself to check whether their document has been modified or not even in Calc.

So, I’ve decided to make it a configuration option. That way we can keep both camps happy. :-) Here is the new check box to toggle this behavior:
always-save-option

Anyway, I hope some of you guys will find this useful, or at least will not find it annoying.

Performance improvement

pagenation-perf-chart
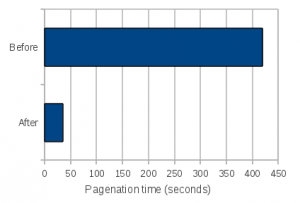
Another stuff worth mentioning is the improvement I made on Calc’s pagination performance. Pagination refers to the action of calculating appropriate positions to set page borders over the entire sheet based on the current page size, row/column sizes, presence of manual page breaks and several other factors. I had previously worked on optimizing this when we increased Calc’s row limit to 1 million rows (as I also mentioned during my talk in Orvieto), but apparently that optimization still had massive room for improvement; the test document I had took 7 minutes to perform pagination during printing! Granted, the document had 98 pages to print, but I bet that no one wants to wait that long to print even if the document has that many pages.

Long story short, I have reduced the duration from 7 minutes to roughly 35 seconds. Though I’m very happy with the result, it required a large amount of refactoring to get to that point, and when a large amount of code changes, the chance of introducing regressions unfortunately goes up. So, please pay special attention to Calc’s pagination behavior and its handling of row heights, and if you notice any problems, I’d like to hear from you, preferably with a test document or two.

DataPilot field popup window

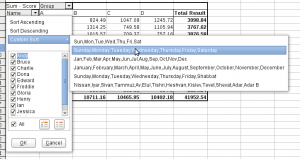
Last but not least, I’d like to mention this one. The DataPilot field popup window has been in the works for quite some time since 3.1. I have blogged about the initial version and the 2nd incarnation. Now the 3rd incarnation is on the horizon. As they say, a picture is worth a thousand words. So without further ado, let’s take a look at the screenshot:
dp-popup-window
This version has a “toggle all” check box to quickly turn on and off all field members, “select only current” button to only select currently selected member, and “unselect only current” button to select all but the current member. Also not visible on this screenshot is the support for Gnome accessibility framework, which is also new in this version.

So…

These are the highlights of some of the stuff I’ve been doing recently. There are more things on the horizon, so stay tuned.

Automatic decimal place adjustment by column width

Adjusting decimals by column width

Here is what I’m working on at the moment. I’m working on changing Calc’s behavior so that when a value is entered into a cell, and the cell width is not wide enough to show all its significant digits, it will truncate it to fit the available column width when the number format of that cell is General.

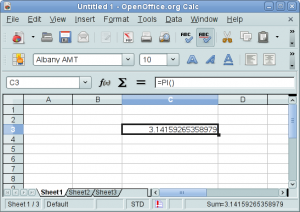
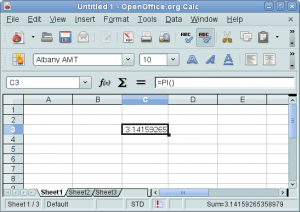
Let me demonstrate this using the value of PI entered into a cell. I have made the column wide enough to show all available significant digits of the PI value. This is what it looks like first:
auto-decimal-1

Then I’ve decided that the column is too wide for my liking, and dragged the column border to make it narrower:
auto-decimal-2
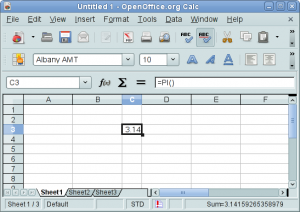
Notice that the displayed value now has less digits to fit the new column width. Now, I have decided to make the column even more narrow. See what happens when I do that:
auto-decimal-3
The cell now only displays “3.14”. But as I said, this automatic decimal place adjustment takes place only when the cell’s number format is General. If the number format specifies some fixed decimal places for that cell, Calc won’t adjust decimals automatically, and gladly displays “###” when the value doesn’t fit the current column width.

Default decimal places

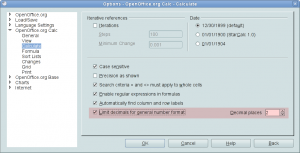
Some of you may notice that, using the current version of Calc, a cell with the value of PI only shows 3.14, or typing any number into a cell only shows up to 2 decimal places unless you manually specify decimal places for that cell. That’s because Calc by default only shows 2 decimal places for cells with General number format. You can change that by increasing or decreasing the default number of decimal places in the Options dialog (in the Calculate page). However, that behavior is a bit confusing, especially when you type in a number such as 3.01234 and the cell only displays 3.01 even though there is enough space to show the whole value. That’s another thing I’m working on to change.

The new Calculate page now has an additional check box at the bottom. You can check or uncheck this check box to either limit the number of decimal places for cells with General number format, or leave it unlimited.
auto-decimal-option
What the default behavior should be is still under discussion, but I’m pretty sure that we will agree on leaving it unlimited by default.

Thank you Google, once again!

I just received a nice gift of a free T-shirt from Google
google_soc
for participating in 2009 Google Summer of Code event as a mentor. Thank you Google, for this good-looking T-shirt! I still have the one I got from 2 years ago, you know. :-)

It came in by FedEx, and the funny thing is, when the carrier left my T-shirt at the front door of my house, I received an email notification quicker than I noticed anyone leaving the package at the door. I understand that the world is becoming more and more “connected”, but I never expected the world being “connected” this much!

Anyway, I know that the Google Summer of Code is all about the students writing cool code and all, and the mentors are there to enable them to their full potential. But it’s nice to receive some recognition for the hard-working mentors as well.

HackWeek – Minor polish

As some of us already blogged, the last week was a Hack Week inside Novell, where we the Novell engineers are allowed to work on whatever project we are pleased to work on. Given the opportunity, I decided to work on some UI polish work for OOo that I had always wanted to work on but could not due to other priorities. These are the results of my Hack Week effort.

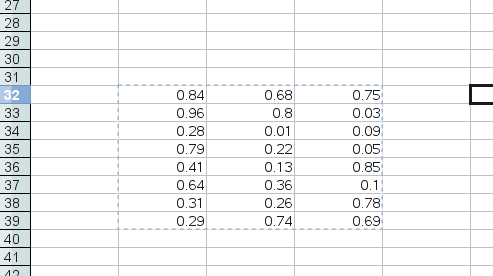
First, I wanted to implement animated border to outline copied ranges. Currently, copied ranges are outlined with static solid borders, but it was not always obvious to the users what those borders were for. Excel and Gnumeric, for instance, use animated dashed borders, which look more intuitive than static borders to depict copied ranges. Long story short, we now have animated dashed borders in Calc as well.

It’s not obvious in the above screenshot since it’s a static image, but trust me, it does animate. ;-) I consider this a natural extension of the previous work that Jon Pryor did for pasting on ENTER key.

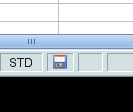
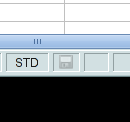
The second work I did was to brush up the document modified status window, to display disk image to indicate whether the document is modified or not. Previously OOo displayed ‘*’ when the current document is modified, or none if it is not modified. I wanted to make it a little fancier so that it would catch more attention of the users. Anyway, here is the result.


This is what the status bar looks like when the document is modified. The image I used here is basically a reduced version of the save icon in Tango icon theme. However, I am not an artist, and I don’t consider this image to be a final version. So the final image is still subject to change without notice.


This is what the status bar looks like when the document is not modified. Basically a black & white version of the document-modified image, with some translucency applied.

That’s all the work I did during Hack Week. I couldn’t spend as much time as I would have liked since I still had to take care of other tasks even during Hack Week, but hopefully you guys like what I did.